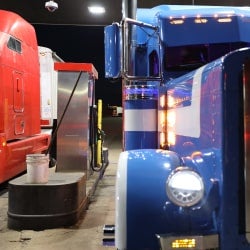
Brokers
Move more freight and solve for any problem, with access to the most trucks and the deepest data.

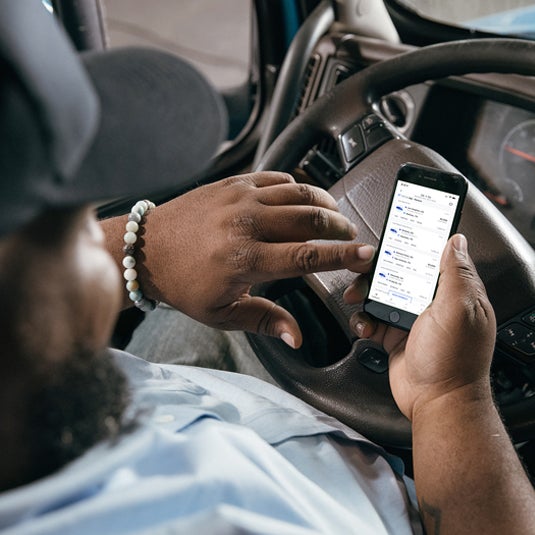
Carriers
Find the best loads first on trucking’s largest load board network, with support from dock to dock and beyond.

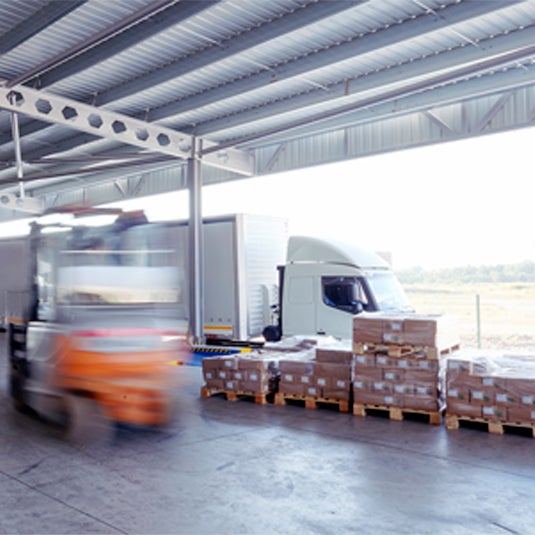
Shippers
Take charge of your transportation and logistics network, with a 360-degree view of truckload markets.
Brokers
Move more freight and solve for any problem, with access to the most trucks and the deepest data.
Carriers
Find the best loads first on trucking’s largest load board network, with support from dock to dock and beyond.
Shippers
Take charge of your transportation and logistics network, with a 360-degree view of truckload markets.

Carriers
Find the best loads first on trucking’s largest load board network, with support from dock to dock and beyond.

Brokers
Move more freight and solve for any problem, with access to the most trucks and the deepest data.

Shippers
Take charge of your transportation and logistics network, with a 360-degree view of truckload markets.
Brokers
Move more freight and solve for any problem, with access to the most trucks and the deepest data.
Carriers
Find the best loads first on trucking’s largest load board network, with support from dock to dock and beyond.
Shippers
Take charge of your transportation and logistics network, with a 360-degree view of truckload markets.
End-to-End Solutions
Learn More
The Most Accurate Insights
Learn More